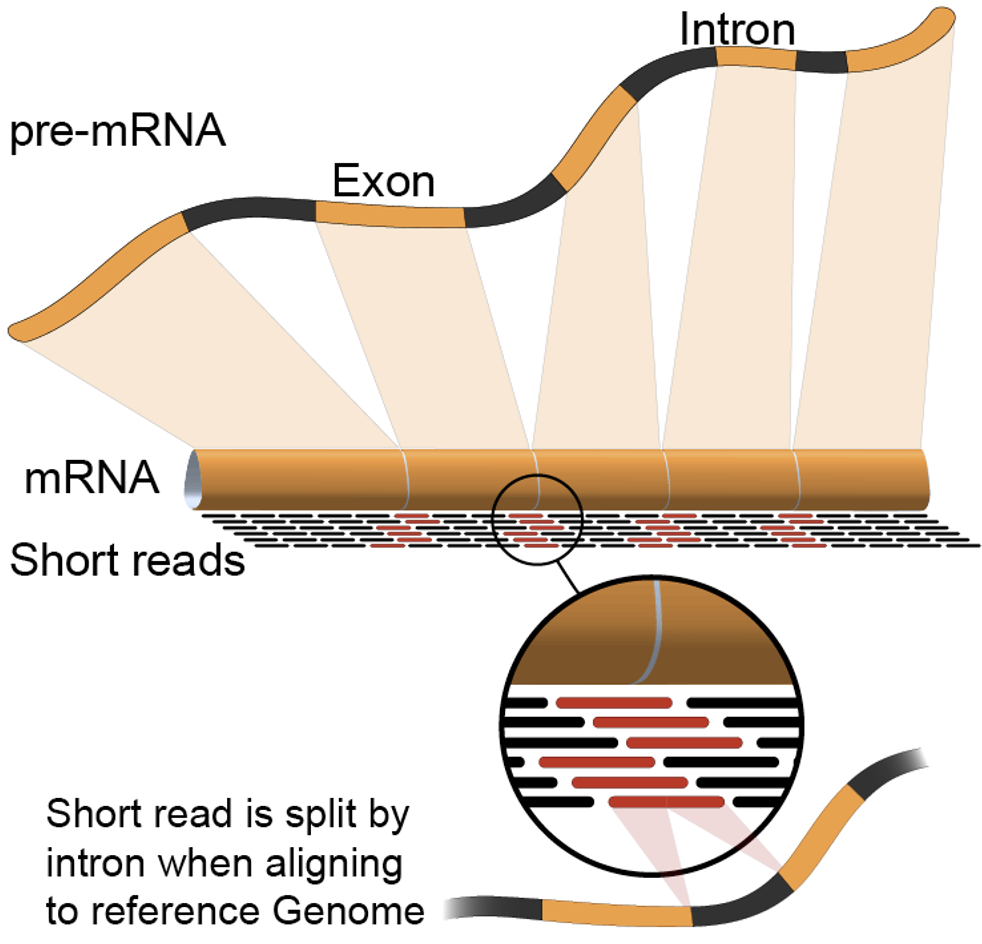
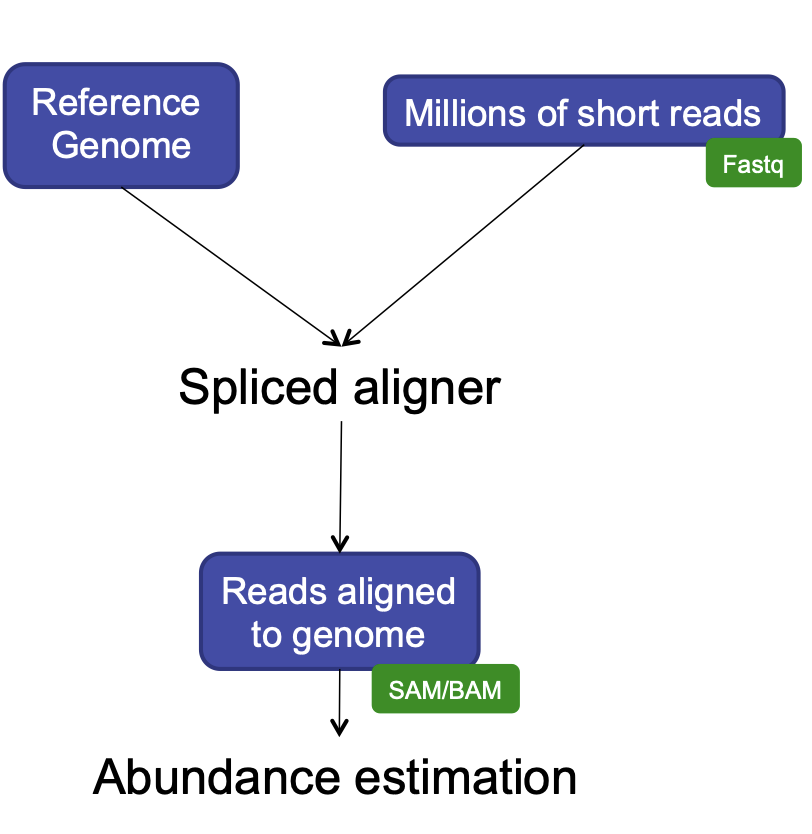
Image 1 of 1: ‘pre-spliced mRNA is spliced, sequenced, and aligned to a genome’
RNA Sequencing
Figure 2
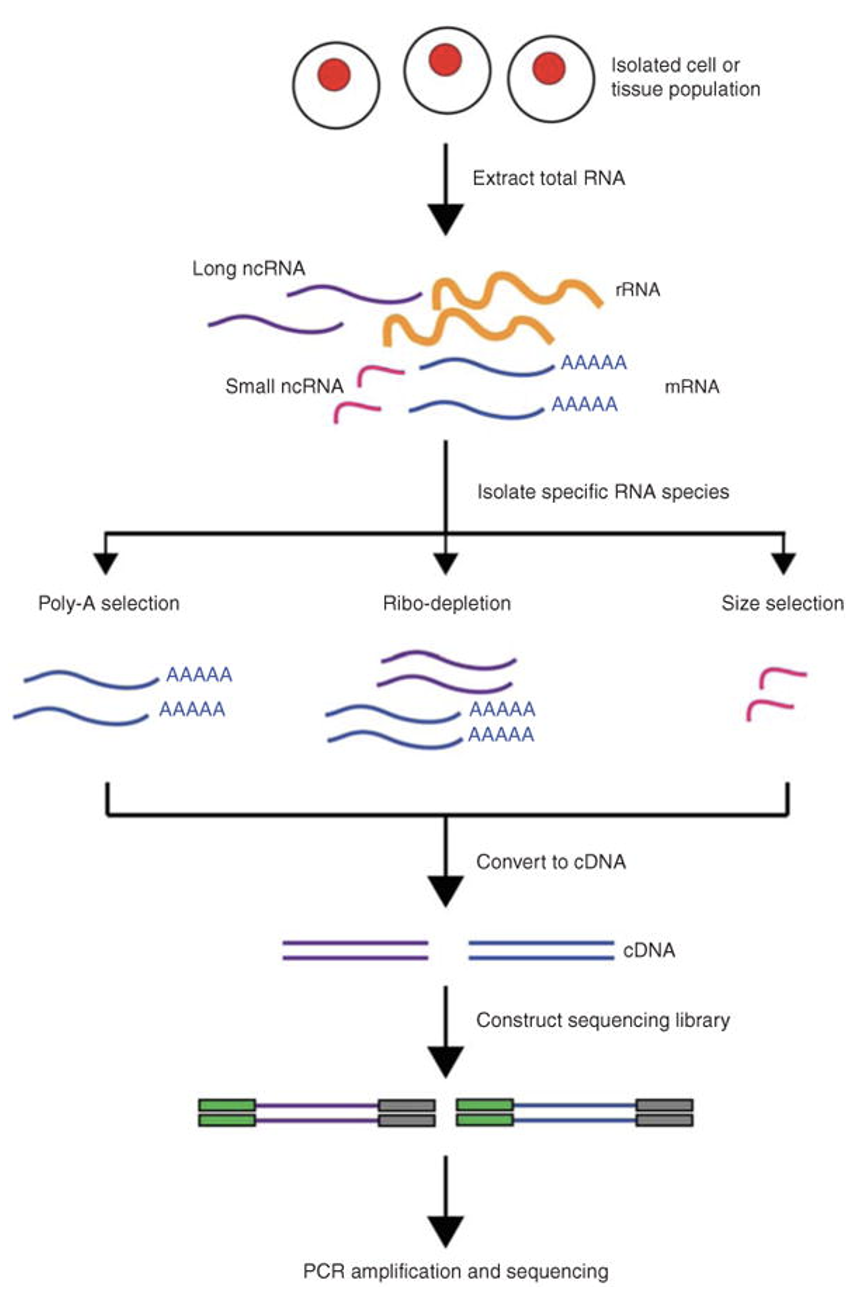
Image 1 of 1: ‘Total RNA is extracted from cells, RNA types can be isolated, then these are reverse-transcribed into cDNA, adapters added, then sequenced’
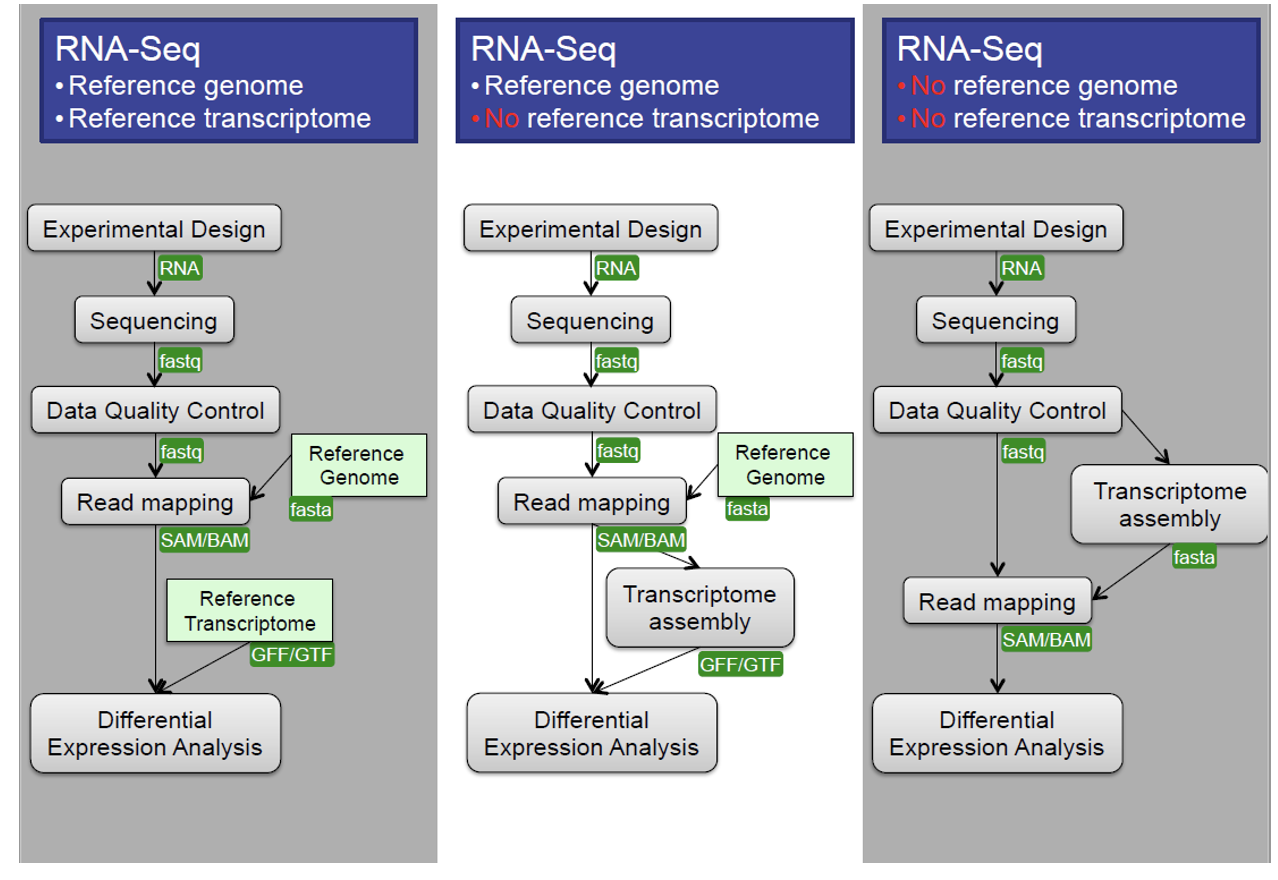
RNA-Seq Workflow Diagram
Figure 3
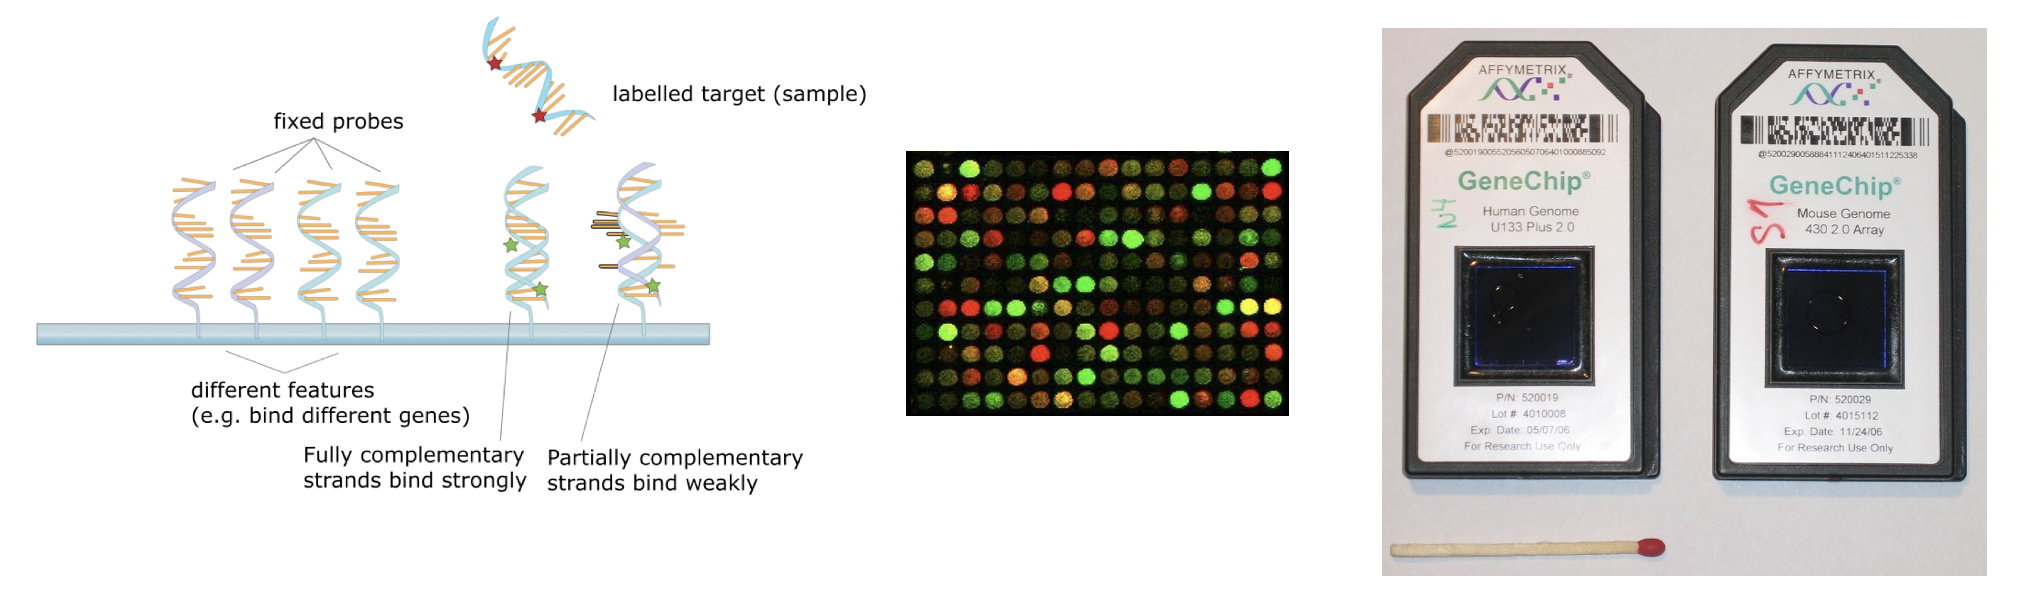
Image 1 of 1: ‘Visualization of microarrays from hybridization to imaging to the whole array’
MicroArray
Figure 4
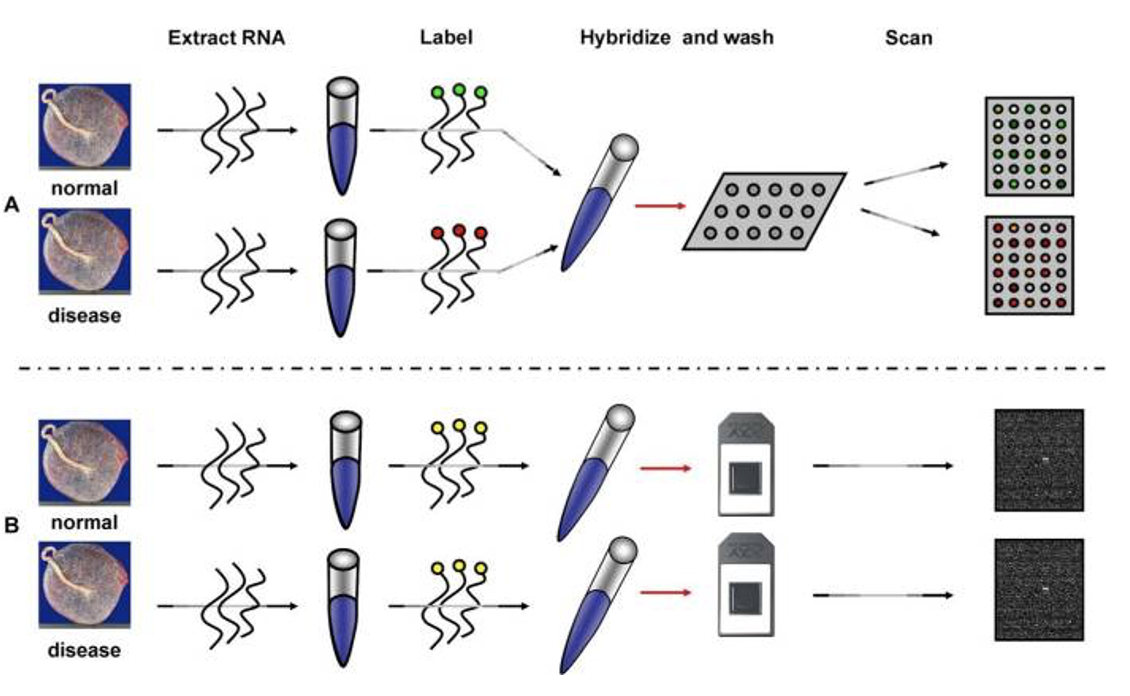
Image 1 of 1: ‘Two possible microarray workflows’
MicroArray vs RNA-Seq
Figure 5
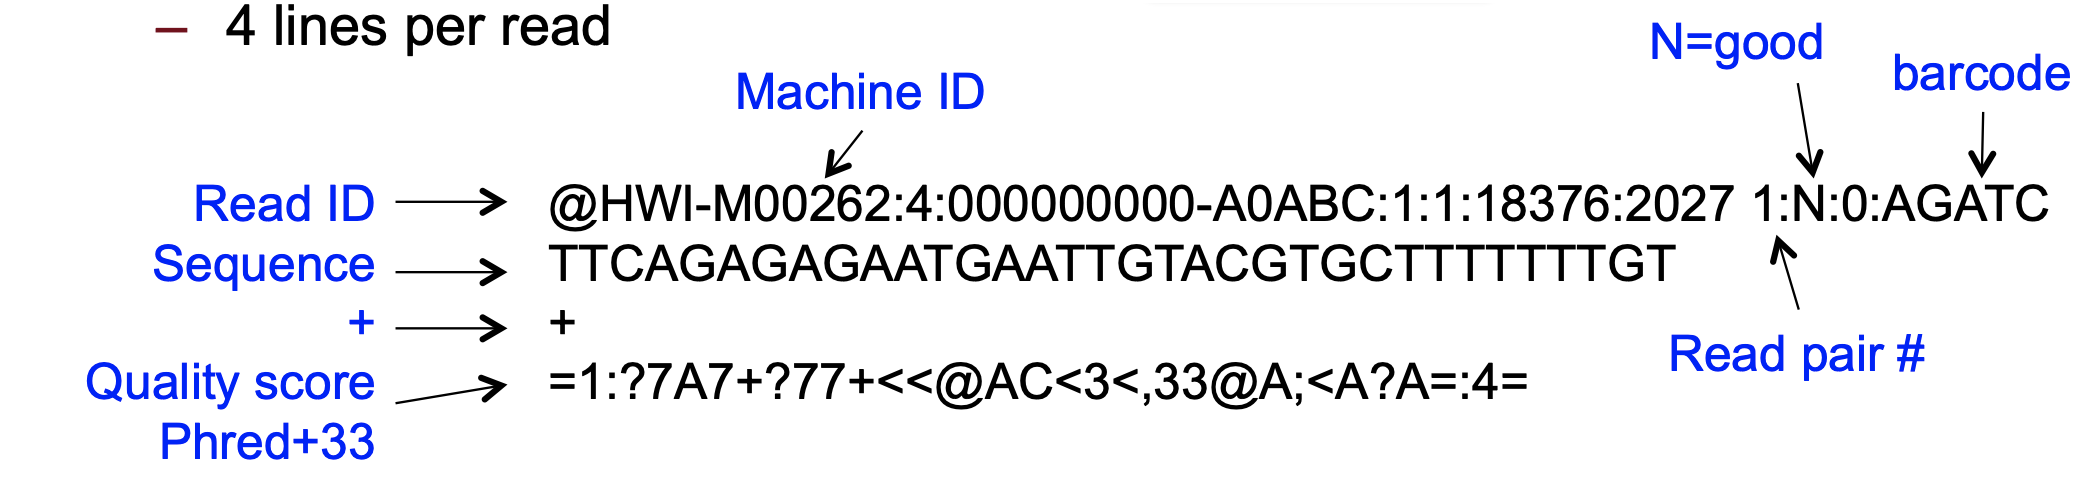
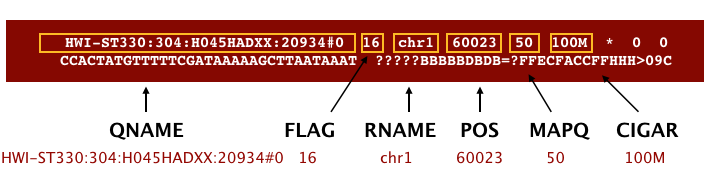
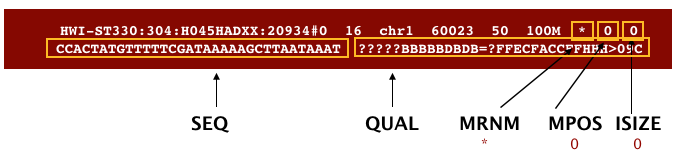
Image 1 of 1: ‘Diagram of fastq format’
Fastq format
Figure 6
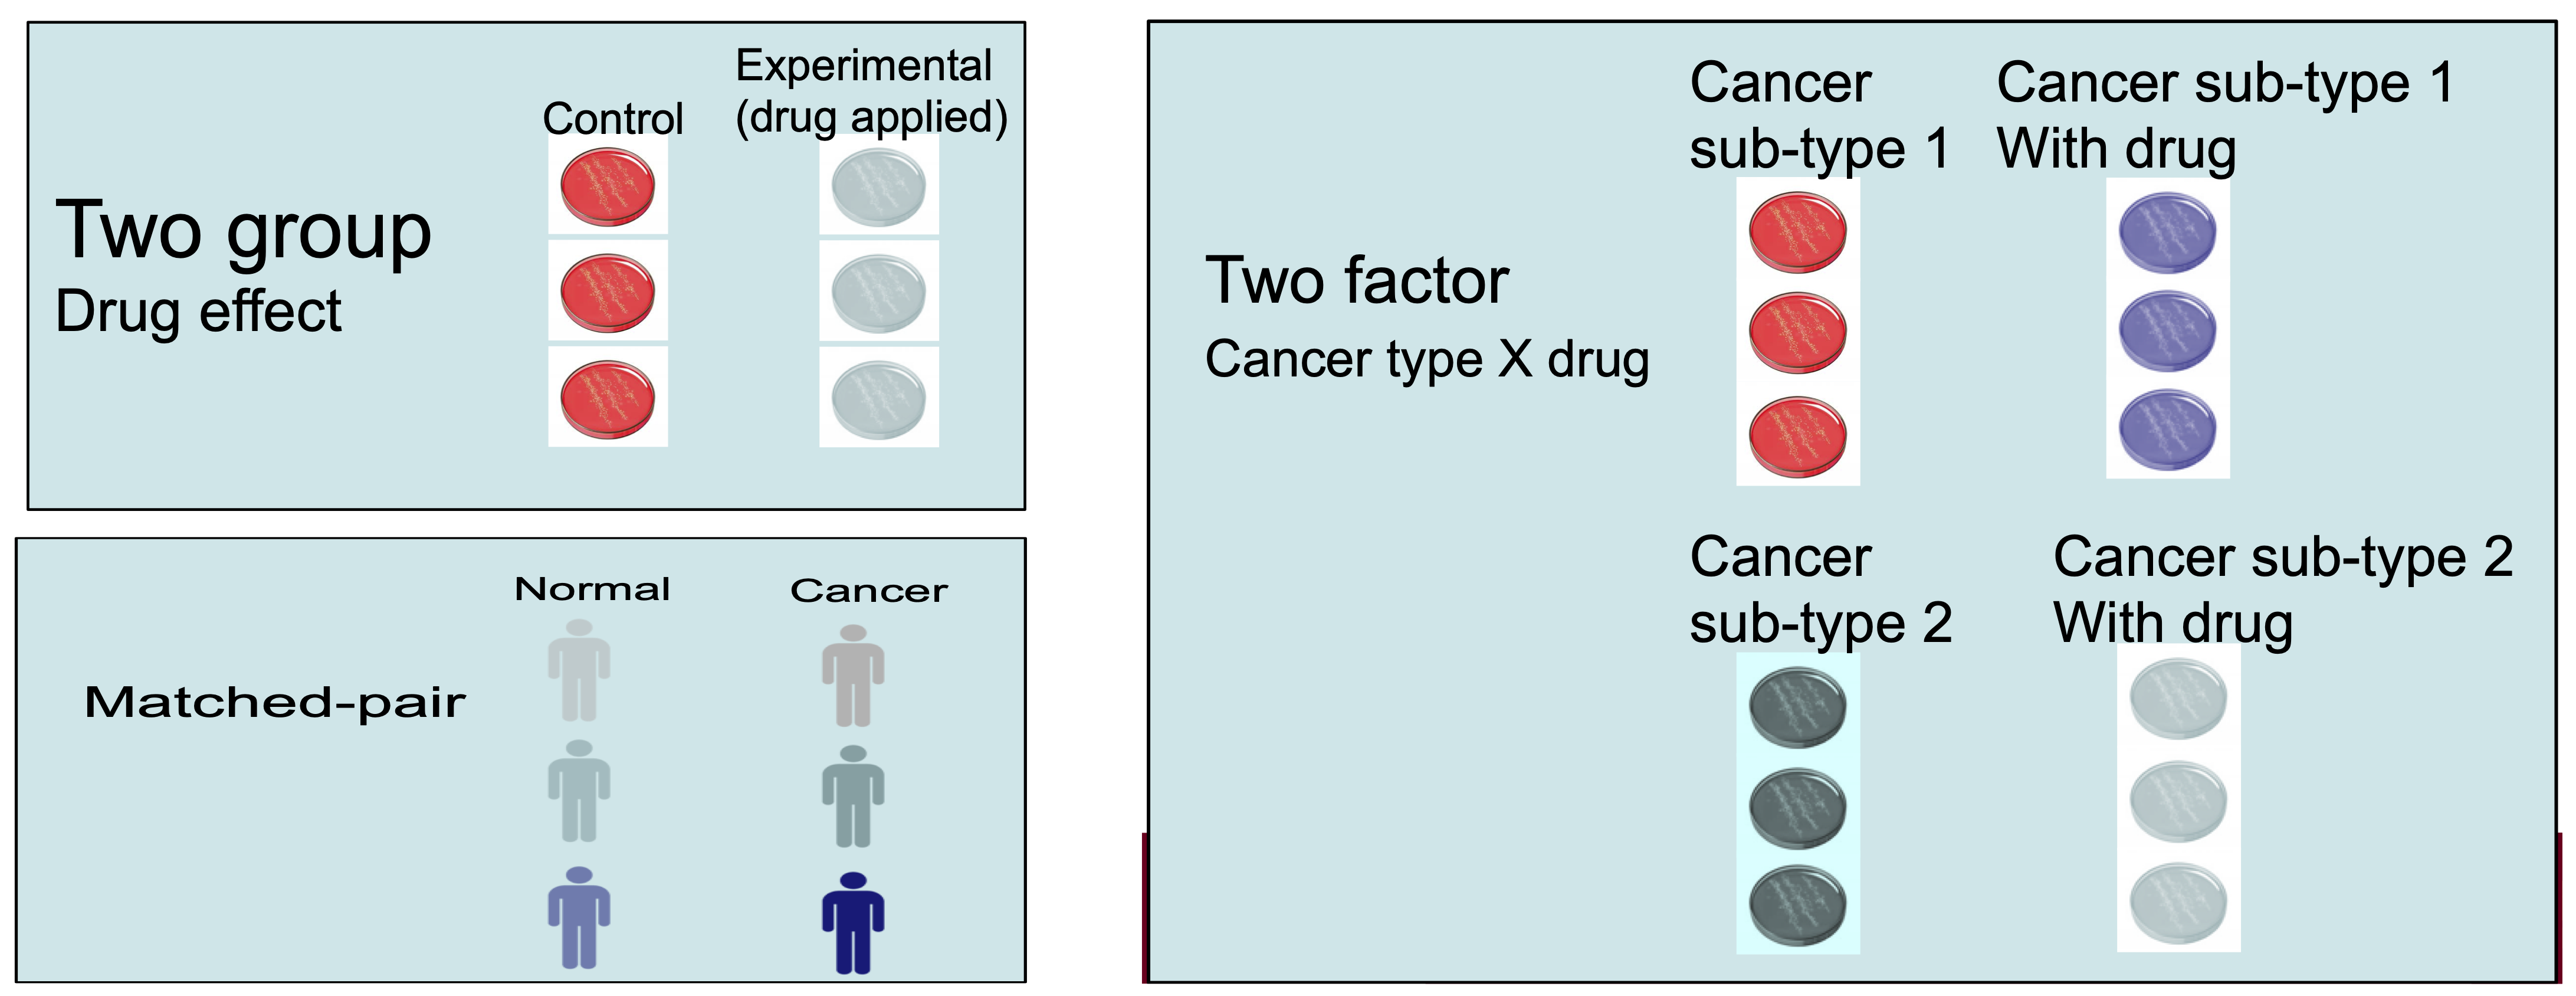
Image 1 of 1: ‘Example case-control experimental design’